Estado de rutas · Río Negro
Every day, Río Negro's road authority publishes the state of the provincial routes as a table in a PDF. In winter, anyone driving to Bariloche, El Bolsón or across the Línea Sur needs to know whether a road is passable, whether chains or 4×4 are required, and not to read a document. This app reads that report with AI, turns it into filterable data, draws it on a map and builds a trip planner that analyses road conditions section by section. In Spanish and English, for tourists.
The problem
Every day, Vialidad Rionegrina publishes a road-conditions report for Río Negro's provincial routes: a table in a PDF with the state of each section, whether chains or 4×4 are required, and the day's remarks. It is official and valuable information, but it is meant to be read, not queried. In the middle of the winter operation, someone heading to Bariloche or El Bolsón, or crossing the Línea Sur, wants a concrete answer: can I get through here, and under what conditions?
What it does
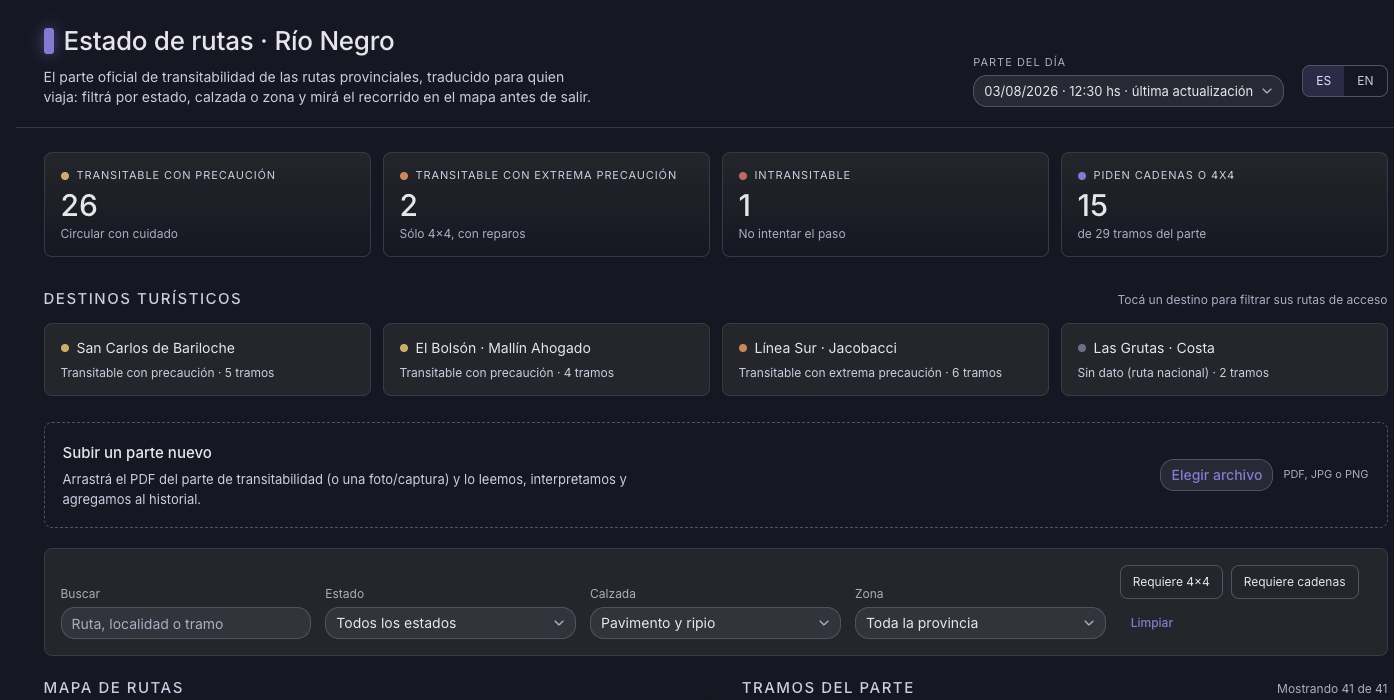
- A summary of the report with sections by status: passable with care, with extreme care, closed, and how many require chains or 4×4.
- Tourist destinations as shortcuts: tap Bariloche or Las Grutas and see only their access routes.
- Filters by status, surface (paved or gravel), area and vehicle requirements, plus a search by route, town or section.
- A map with every section coloured by status, over streets or satellite imagery.
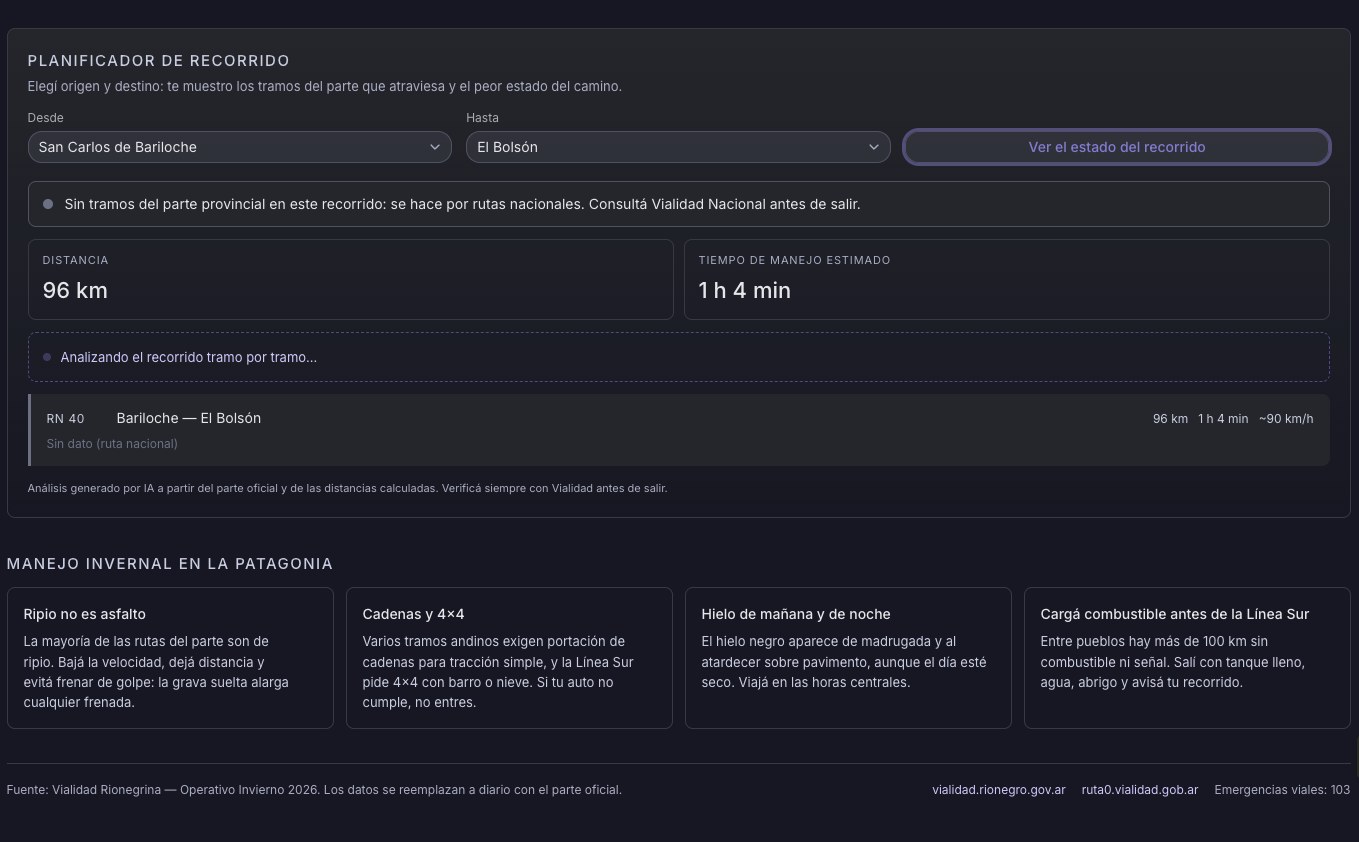
- A trip planner: pick origin and destination and the app chains the sections the trip crosses, computes distance and time with the speed each section's condition allows, and an AI assistant summarises the worst section, the alerts and the advice, using only the report's data.
- Winter driving tips for Patagonia and links to the official sources.
- Everything in Spanish and English, because many of the people checking are tourists.
How it reads the report
The report arrives as a PDF or a photo. The upload endpoint checks the file's real signature, not the type the client declares, and hands it to Claude Haiku 4.5 with a strict schema: extract only what the document says, one section per row, matching each one against a catalogue of known sections to inherit its map geometry and its planner nodes. If the document is not a road report, it returns an empty list and nothing is stored. The result is persisted in MongoDB and the original file in Vercel Blob, with a bounded history.
Technical decisions
- Structured output, not free text: the model fills a zod-validated schema, and the prompt treats the document's content as data, never as instructions.
- Two models for two jobs: Haiku for extraction, which is mechanical and frequent, and Claude Sonnet 4.6 for the trip analysis, where judgement matters. Both through Vercel's AI Gateway.
- The planner doesn't ask the AI which way to go: it is a Dijkstra over each section's real geometry. The model receives kilometres, speeds and minutes already computed and only interprets road conditions.
- Hardened for public exposure: origin check against CSRF, per-IP rate limiting, maximum file and body sizes, and validation of everything that reaches the prompt so nobody can use the app as a free LLM proxy.
- Next.js 16 and React 19, shadcn/ui on Base UI, TanStack Query for client state and Leaflet for the map. Open source under the MIT licence.
Status
In production with real data from the 2026 winter operation. I designed and built it in a day with AI-assisted development, starting from a Claude Design project, and shipped it the same day. Data is replaced by uploading each day's official report.